Introduction
As more people seek Applied Behavior Analysis (ABA) services, the role of Registered Behavior Technicians (RBTs) is becoming increasingly important. With this growing demand for effective behavioral support across the country, it’s essential for job seekers and employers to understand RBT salaries. By 2025, pay differences are notable, influenced by where you live, the cost of living in that area, certification levels, and local job demand. This article takes a closer look at average RBT salaries in each state, including hourly rates, annual earnings, and trends specific to different regions
Overview of RBT Careers and Salary Trends
Registered Behavior Technicians, or RBTs, play a vital role in behavioral health. They follow behavior plans, monitor how clients are doing, and offer direct support while working under a Board Certified Behavior Analyst. Recently, the average salary for RBTs in the U.S. is about $39,610 a year, which breaks down to about $19.05 an hour, but this can differ widely depending on the state.
Key highlights include:
- Hawaii: Recognized as the highest-paying state for RBTs with salaries reaching around $54,222 annually.
- High-Cost Areas: States with higher living costs such as California, New York, and Massachusetts typically offer above-average salaries.
- Regional Variations: Factors such as local funding, demand for ABA services, and competition in the market influence the overall pay scale.
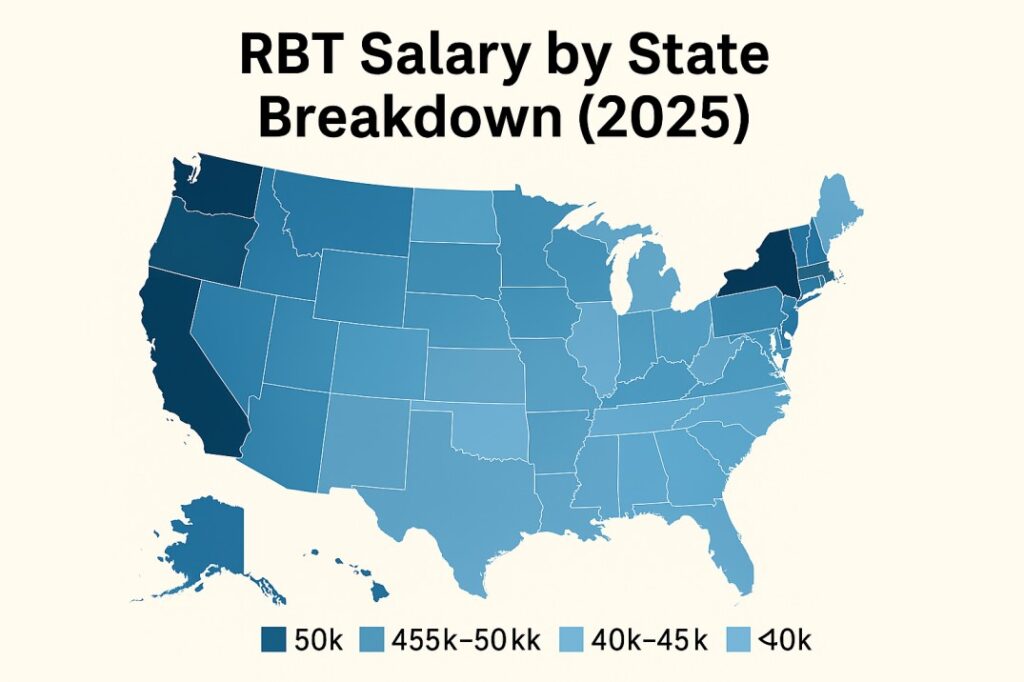
State-by-State Breakdown of RBT Salaries (2025)
The table below provides an illustrative guide to average hourly rates and annual salaries for RBTs across various U.S. states in 2025. These figures assume full-time employment (2,080 hours per year) and are derived from recent market data and expert salary analysis.
| State | Average Hourly Rate ($) | Approx. Annual Salary ($) |
|---|---|---|
| Alabama | 19.00 | 39,520 |
| Alaska | 22.00 | 45,760 |
| Arizona | 20.00 | 41,600 |
| Arkansas | 18.50 | 38,480 |
| California | 25.50 | 53,040 |
| Colorado | 20.00 | 41,600 |
| Connecticut | 24.00 | 49,920 |
| Delaware | 20.00 | 41,600 |
| Florida | 21.50 | 44,720 |
| Georgia | 20.00 | 41,600 |
| Hawaii | 26.07 | 54,234 |
| Idaho | 19.00 | 39,520 |
| Illinois | 20.00 | 41,600 |
| Indiana | 19.00 | 39,520 |
| Iowa | 18.50 | 38,480 |
| Kansas | 18.50 | 38,480 |
| Kentucky | 18.00 | 37,440 |
| Louisiana | 18.50 | 38,480 |
| Maine | 20.00 | 41,600 |
| Maryland | 21.00 | 43,680 |
| Massachusetts | 24.00 | 49,920 |
| Michigan | 19.00 | 39,520 |
| Minnesota | 19.00 | 39,520 |
| Mississippi | 17.50 | 36,400 |
| Missouri | 18.00 | 37,440 |
| Montana | 18.00 | 37,440 |
| Nebraska | 18.50 | 38,480 |
| Nevada | 20.00 | 41,600 |
| New Hampshire | 20.00 | 41,600 |
| New Jersey | 20.50 | 42,640 |
| New Mexico | 18.50 | 38,480 |
| New York | 21.00 | 43,680 |
| North Carolina | 19.00 | 39,520 |
| North Dakota | 18.50 | 38,480 |
| Ohio | 19.00 | 39,520 |
| Oklahoma | 19.00 | 39,520 |
| Oregon | 21.00 | 43,680 |
| Pennsylvania | 20.00 | 41,600 |
| Rhode Island | 21.00 | 43,680 |
| South Carolina | 19.00 | 39,520 |
| South Dakota | 18.00 | 37,440 |
| Tennessee | 19.00 | 39,520 |
| Texas | 22.80 | 47,424 |
| Utah | 20.00 | 41,600 |
| Vermont | 20.00 | 41,600 |
| Virginia | 21.00 | 43,680 |
| Washington | 21.00 | 43,680 |
| West Virginia | 18.00 | 37,440 |
| Wisconsin | 19.00 | 39,520 |
| Wyoming | 18.50 | 38,480 |
Factors Affecting RBT Salaries Across States
RBT salaries vary for several reasons, including:
- Geographic Location: States with a higher cost of living, such as Hawaii and California, tend to offer higher salaries to help offset expenses.
- Market Demand: Areas with increased demand for ABA services or a shortage of certified technicians often drive wages upward.
- Certification & Experience: Additional training, certifications, and extensive field experience can significantly boost an RBT’s earning potential.
- Employer Type: Differences in funding between private practices, educational institutions, and non-profit organizations also affect salary scales.
Top Paying Cities and Regions
Beyond state-level differences, cities within high-paying states often emerge as salary hotspots. Below is a table summarizing the top 10 cities where RBTs command premium wages in 2025:
| Rank | City | Average Salary | Hourly Rate |
|---|---|---|---|
| 1 | Urban Honolulu, HI | $54,234 | $26.07 |
| 2 | Campbell, CA | $46,546 | $22.38 |
| 3 | Worcester, MA | $44,464 | $21.38 |
| 4 | Baltimore, MD | $42,536 | $20.45 |
| 5 | New York, NY | $42,350 | $20.36 |
| 6 | Lakewood, WA | $42,347 | $20.36 |
| 7 | Lakewood, NJ | $42,115 | $20.25 |
| 8 | Chicago, IL | $41,072 | $19.75 |
| 9 | Saint Paul, MN | $37,623 | $18.09 |
| 10 | Lakewood, CO | $36,340 | $17.47 |
This table reveals that cities with higher living expenses and more concentrated healthcare or educational markets (like Urban Honolulu and Campbell) tend to offer significantly higher wages. Such detailed local insights help RBTs identify opportunities that align with their personal and professional goals.
Career Progression and Salary Growth
RBT salaries are not static; they improve with both experience and additional training. Data indicates a clear trajectory for salary growth as professionals gain experience in the field. Below is an illustrative table showcasing how salary expectations evolve over time:
| Years of Experience | Hourly Rate | Approximate Annual Salary |
|---|---|---|
| Less than 1 year | $16.21 | $33,717 |
| 1–4 years | $17.18 | $35,734 |
| 5–9 years | $18.11 | $37,669 |
| 10–19 years | $18.84 | $39,187 |
| 20+ years | $20.00 | $41,600 |
As illustrated above, the financial benefits of gaining experience and refining skills are evident. Entry-level RBTs start at around $16.21 per hour, but sustained career development can progressively unlock more lucrative compensation brackets—even pushing hourly wages past $20 in later stages. Complementary skills and certifications, such as CPR training or additional behavioral health qualifications, can further enhance these figures, serving as a testament to the long-term reward of ongoing professional development
Future Outlook for RBT Salaries
The future for RBT compensation looks bright. As more money flows into ABA therapy and behavioral interventions, job opportunities should grow. RBTs who keep up with industry changes and consider getting additional certifications are likely to earn higher salaries. This trend highlights the importance of RBTs and opens doors for advancement in the behavioral health field.
Conclusion
To sum it up, salaries for Registered Behavior Technicians have been gradually increasing from 2013 to 2022. This rise is due to a greater demand for their skills, better training requirements, and changes in the job market. If you’re looking into a career in Applied Behavior Analysis, knowing these salary trends can really help you negotiate fair pay and think about your future career path.

